2022 Market Outlook

Macroeconomic Outlook – The Covid-19 pandemic and resulting economic shutdown quickly threw the global economy into a deep recession. Within a very short period, economic growth was in a steep decline, business and consumer confidence was at all-time lows, and we faced a steep deflationary environment. Monetary and fiscal policy authorities deployed massive accommodative policies to help bridge the economic gap to a post-Covid world, and we quickly started a new economic recovery. We do not want to continuously rehash the events that unfolded in 2020 and 2021, but we believe it is important to understand the transition from one stage of the economic cycle to another which happened quicker than normal. We think this is an incredibly important factor to note as, looking forward, we believe we are once again likely to be looking towards a transition in the economic cycle during the next 12 to 24 months – from Mid to Late cycle.
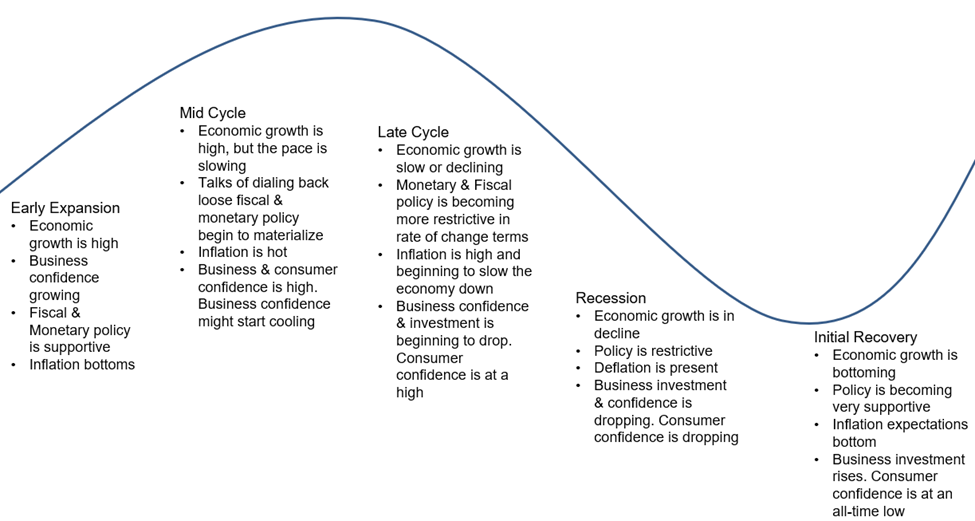
- Leading Economic Indicators – These indicators continue to point towards positive economic growth over the next 12 to 18 months. The Conference Board’s Leading Economic Index, a basket of ten economic data points that tend to lead changes in the economic cycle, has exhibited positive month over month growth for the 19th time in a row. However, the pace of growth in major leading economic indicators is beginning to slow across various time horizons. So, we are experiencing higher than average economic growth with a slowing pace. To us, this points to being Mid Cycle and likely transitioning towards Late Cycle in the next 12 to 18 months.
- Policy – A key theme for 2022 will be a less accommodative monetary policy. The Federal Reserve is coming off almost two years of implementing historically ultra-supportive policies. Interest rates have been set at 0% since March of 2020 and the Fed more than doubled the size of their balance sheet in hopes to provide liquidity to financial markets. These policy decisions allowed for quicker than expected recoveries in both the economy and in the labor market. All the stimulus has also led to higher-than-expected inflation. Due to the rise in inflation, the Fed must react by switching from ultra-accommodative policies to more restive ones in hopes to safely slow the pace of the economy. To combat inflation, the Fed plans to raise interest rates at least three times in 2022 and is even considering selling assets from its balance sheet, a task the Fed calls “balance sheet normalization”. Raising interest rates and shrinking its balance sheet will be a top concern for the Fed, but they must implement these policies carefully, as switching from an accommodation stance to a more restrictive one, can be a daunting task. If the Fed moves too quickly, they run the risk of throwing the U.S. into a recession. If they move too slowly, inflation, over time, can eat away real purchasing power.
- Inflation – Inflation is likely to once again be another polarizing factor for financial markets in 2022. The reopening of the global economy came at a unique time when there was a boom in demand created by pent up savings and never before seen monetary and fiscal stimulus measures, a broken supply chain caused by Covid-19 disruptions, and a falling labor force participation rate. The resulting imbalance between supply and demand caused inflation readings to produce the hottest numbers we have seen since the 1970s. Supply chain disruptions have shown signs of easing in recent months, but we believe we are in for higher-than-average inflation readings for the short-term because of labor imbalances. However, financial markets have likely priced in higher short-term price increases. The Two-Year Breakeven is currently just above 3% – indicating market participants are currently pricing in an inflation rate over the next two years of approximately 3%. What is interesting is longer-term readings of expected inflation are pricing in a much more moderate rate of inflation. For instance, the Five-Year Breakeven is closer to 2.75% and the Ten-Year Breakeven is around 2.5%. Not only are these measures of longer-term inflation expectations closer to the Fed’s 2% target, but they have all exhibited downward pressure since the beginning of 4Q 2021 – a result of what we believe is a longer-term disinflationary trend. In the decade leading up to the Covid-19 pandemic, central banks struggled to reach inflation targets as an aging demographic and the greater adoption of technology provided a deflationary headwind. We believe the pandemic will exacerbate these trends in the long term, but the supply imbalance caused by labor shortages will keep price changes higher than what we have grown accustomed. This imbalance is likely the factor we are watching most in 2022. But, as of right now, we do not believe we will reach the level of inflation seen in the 1970s many investors have been weary of late.
Equity Market Outlook
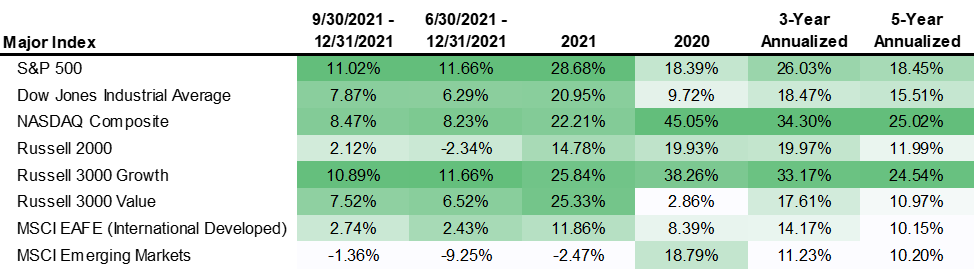
2021 was a year of resilience for equity markets. Amidst some of the highest uncertainty, we have seen since 2008, major equity indexes posted strong returns with the exception of Emerging Markets. For the third year in a row, the S&P 500 climbed more than 15%. While 2020 generated large dispersion in returns between styles, sectors, and themes, 2021 saw a more united rise across approaches to equity investing. Our outlook for the next 12 to 18 months remains constructive for equities, but less so than recent periods. We believe relative valuations, the lack of alternatives, and an expected rise in profits point to long-term upside for equity prices. However, we are taking a more defensive approach to equity exposure as we mature in the economic cycle, monetary policy measures become more restrictive and absolute valuations remain very high. We delineate these viewpoints below in greater detail:
- Our Macro Outlook is we are Mid Cycle. While economic growth is likely to remain high, the pace of the growth should slow as we get closer to full employment and closer to our pre-pandemic stage of trend growth. The primary point is equities are less likely to easily digest volatility as this happens. Equity prices climbed walls of worry created by uncertainty behind Covid, politics, and inflation as there was clear upside in terms of how high economic growth was expected to be.
- Another key point of our Macro Outlook is the central bank policy is likely to become more restrictive. During 2020 and most of 2021, monetary policy across global central banks was incredibly expansionary and helped drive investors to spend more money and purchase financial assets. This policy framework began changing in late 2021 as the Fed started tapering the amount of assets being added to the balance sheet, and investors began pricing in a higher chance of interest rate hikes in the near term. This change to a more restrictive policy framework is important for a few reasons. Most importantly to stocks, the expansion of the Fed’s balance sheet and cutting of interest rates to near zero incentivized investors to pay a higher price (in terms of valuation) for stocks by being a source of liquidity and taking away the opportunity cost from other investments (bonds). This rate of change to a more restrictive policy framework is less constructive for equities moving forward.
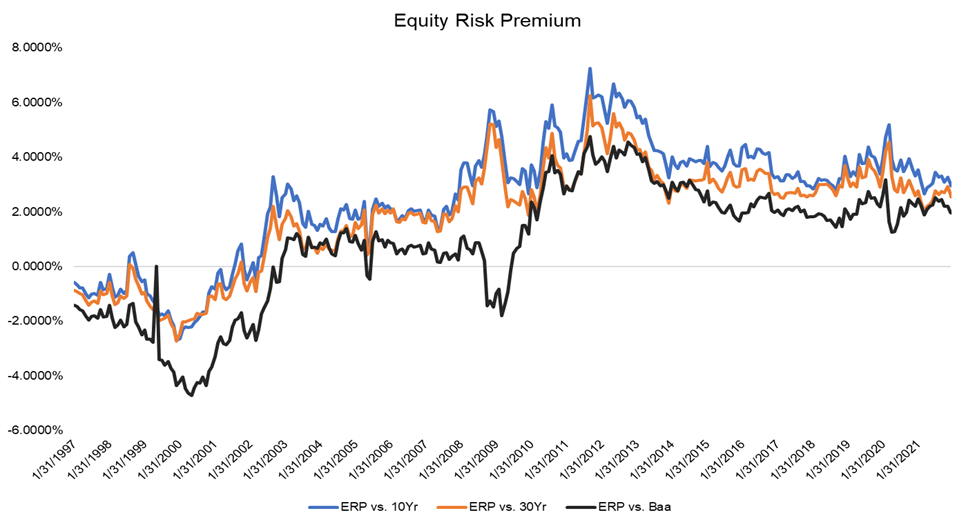
- When comparing current equity valuations to their average over the last two decades, they look expensive on almost every level. However, we have been large proponents of the idea high valuations do not necessarily create bear markets in stocks which led us to continue to be long equities in 2021 when the market continued to rise amid skepticism in how high valuations were. However, as the Fed’s policy becomes more restrictive, investors will be less willing to pay as high of a multiple for stocks, causing us to believe 2022 will likely be a year of multiple contraction. We remain constructive on stocks in the long-term as their relative valuation versus bonds remains attractive. Our preferred way to compare the valuations between stocks and bonds is the Equity Risk Premium, which compares the yield that a dollar of investor capital is generating in earnings to the yield investors, are receiving off popular bond investments. By this measure, stocks remain attractive in the long term. The chart below shows the Equity Risk Premium for the S&P 500 to the Ten-Year Treasury Yield, the 30-Year Treasury Yield, and the yield on investment grade corporate bonds.
- Our outlook on valuations, described above, has a couple of important implications for equity portfolios. For one, we want portfolios to have equity exposure to companies that do not exhibit valuations detached from underlying fundamentals. 2020 and most of 2021 showed investors were very willing to pile into more speculative areas of the equity market. That trend began reversing in late 2021 and we believe it will continue to do so in 2022. We believe equity exposure should be positioned towards high quality companies whose earnings growth can generate positive returns amidst the multiple contraction we believe will come in the next 12 to 18 months.
- Two other tilts we have within equity portfolios moving into 2022 is to be lower beta and higher exposure to international equities relative to target. Our decision to lower the beta of equity exposure comes as we believe higher speculation will continue to fall out of favor, and the broad equity market could move more sideways with multiple contraction and higher volatility. Our decision to overweight international stocks comes as the price investors are paying for International Equity exposure versus that of Domestic exposure has reached an all-time high. This trend in the valuation spread between the two exposures have been building for years, but we believe a tailwind finally exists in the international space to close this gap as major international economies are expected to have higher GDP growth and higher earnings growth than their long-term average. This upside is aided by the slower reopening in international economies post-Covid.
Fixed-Income Market Outlook
2021 was a historically bad year for bonds. The Ten-year Treasury yield ended the year up over 60 basis points. This yield was the biggest annual rise since 2013. Yields rose across the curve and especially at the short end. The Bloomberg Barclays Agg returned -1.61% in 2021. Our stance going in to 2021 was to be underweight fixed income due to low real yields, rising economic growth and inflation, and range-bound yields. Going into 2022, we expect to remain underweight fixed income.
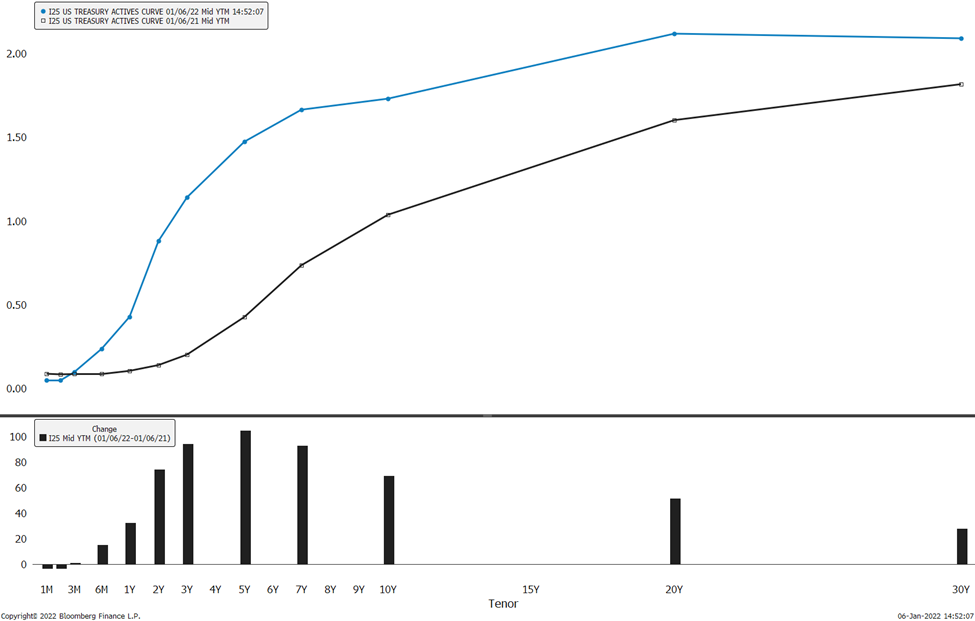
- A key to our fixed-income outlook is understanding the current shape of the yield curve and how it is expected to change going forward. The shape of the yield curve is determined by expectations on inflation, economic growth, and Fed policy changes. Throughout 2021, we saw the yield curve become flatter. Yields rose across the curve but rose more for shorter term bonds. We expect this trend to continue into 2022 and is a primary reason we are going into this year with a negative outlook on fixed income.
- Federal Reserve policy is quickly becoming less accommodative. For the past two years, the Fed has provided financial markets with massive amounts of liquidity through quantitative easing and remained very accommodative by keeping interest rates anchored at 0%. This period of extreme accommodation is over. The Fed is now on pace to end quantitative easing by late March 2022 and is expected to raise interest rates quickly after. The consensus is the Fed will raise the federal funds rate at least three times in 2022. Along with raising interest rates, the Fed is also expected to begin quantitative tightening (the Fed selling government securities) sometime this year. This switch from easy, accommodative policy to restrictive policy will have a significant impact on financial markets.
- While yields are expected to rise in 2022, with some expecting the yield on the Ten-Year Treasury to rise to 2.25-2.5%. We differ in this viewpoint and believe yields will remain low in the long-term as long-term inflation expectations are anchored near 2%, short-term inflation expectations are decelerating, and the Fed is expected to slow inflation even more. As yields do rise, we see this as an opportunity to extend duration and lock in higher yields. In terms of positions within fixed income, we favor high quality over low quality, and we prefer to not take on excess risk from bond positions. We expect slower economic growth and higher volatility going forward and having a tilt toward high quality can help protect portfolios during volatile periods. We also favor taking a bar-belled approach to duration to help take advantage of a flattening yield curve. A more bar-belled strategy involves concentrations in short- and long-dated securities. The allocation to longer dated securities allows us to average into higher yields over time while the allocation to short, dated securities helps reduce interest rate risk by reducing price sensitivity.
- While we have been underweight in bonds for a while, and continue to be into 2022, we still believe bonds are essential to investment portfolios in the long term. Bonds offer diversification and capital preservation benefits are important to overall portfolio performance.
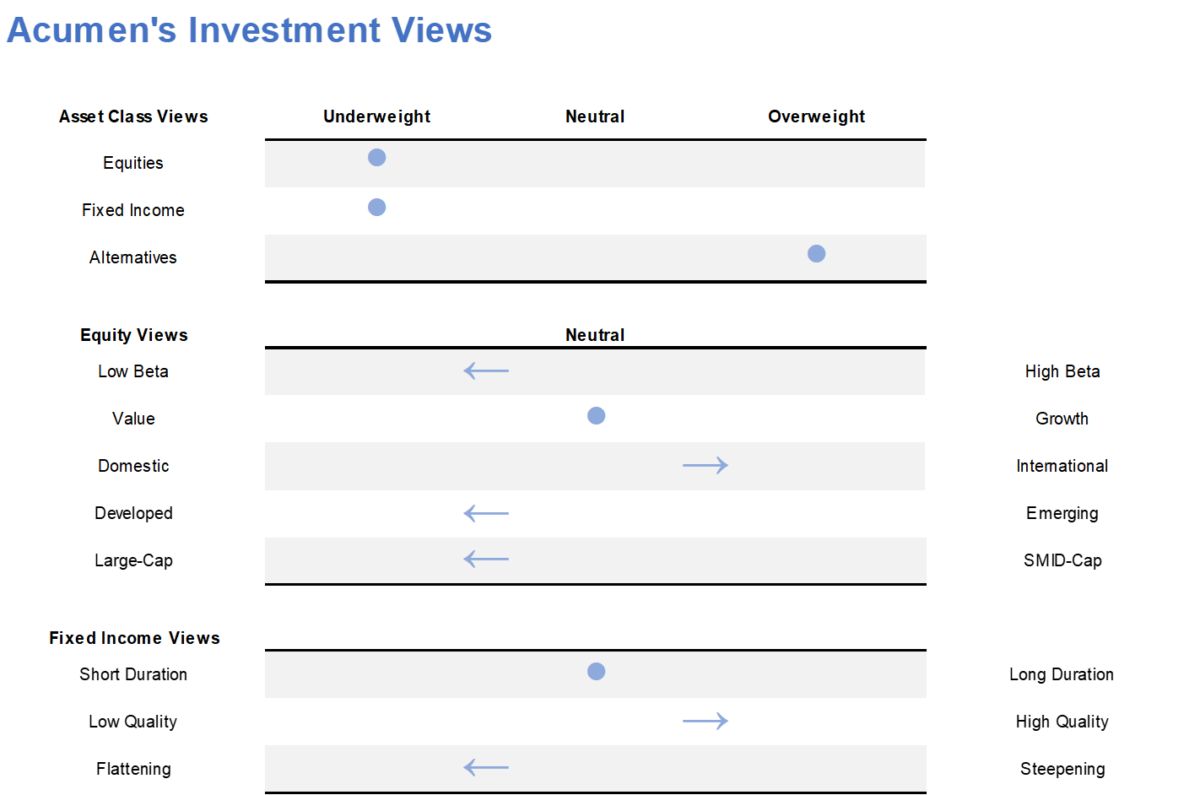
Asset Class Views
All indexes are unmanaged, and an individual cannot invest directly in an index. Index returns do not include fees or expenses.
The Conference Board Leading Economic Index® (LEI) for the U.S. – The composite economic indexes are the key elements in an analytic system designed to signal peaks and troughs in the business cycle. The leading, coincident, and lagging economic indexes are essentially composite averages of several individual leading, coincident, or lagging indicators. They are constructed to summarize and reveal common turning point patterns in economic data in a clearer and more convincing manner than any individual component – primarily because they smooth out some of the volatility of individual components.
The ten components of The Conference Board Leading Economic Index® for the U.S. include:
• Average weekly hours, manufacturing
• Average weekly initial claims for unemployment insurance
• Manufacturers’ new orders, consumer goods and materials
• ISM® Index of New Orders
• Manufacturers’ new orders, nondefense capital goods, excluding aircraft orders
• Building permits, new private housing units
• Stock prices, 500 common stocks
• Leading Credit Index™
• Interest rate spread, 10-year Treasury bonds less federal funds
• Average consumer expectations for business conditions
Gross Domestic Product (GDP) is the monetary value of all finished goods and services made within a country during a specific period.
The 10-year Treasury Yield is used as a proxy for mortgage rates. It’s also seen as a sign of investor sentiment about the economy.
The S&P 500 Index is widely regarded as the best single gauge of the U.S. equities market. The index includes a representative sample of 500 leading companies in leading industries of the U.S. economy. The S&P 500 Index focuses on the large-cap segment of the market, however, since it includes a significant portion of the total value of the market, it also represents the market.
The MSCI EAFE Index (Europe, Australasia, Far East) is a free float-adjusted market capitalization index that is designed to measure the equity market performance of developed markets, excluding the US & Canada.
Fed Funds Rate is the interest rate U.S. banks charge each other to lend funds overnight
The velocity of money is a measure of the number of times that the average unit of currency is used to purchase goods and services within a given time period.
Any charts, graphs, and descriptions of investment and market history and performance contained herein are not a representation that such history or performance will continue in the future or that any investment scenario or performance will even be similar to such chart, graph, or description.
The opinions expressed in this commentary should not be considered as fact. All opinions expressed are as of the published date and are subject to change. This document is a general communication being provided for informational purposes only. It is educational in nature and not designed to be taken as advice or a recommendation for any specific investment product, strategy, plan feature or other purpose. Any examples used are generic, hypothetical and for illustration purposes only. This material does not contain sufficient information to support an investment decision and it should not be relied upon by you in evaluating the merits of investing in any securities or products. In addition, users should make an independent assessment of the legal, regulatory, tax, credit, and accounting implications and determine, together with their own financial professionals, if any investment mentioned herein is believed to be appropriate to their personal goals. Investors should ensure they obtain all available relevant information before making any investment. Any forecast, figures, opinions or investment techniques and strategies set out are for information purposes only, based on certain assumptions and current market conditions and are subject to change without prior notice. All information presented herein is considered to be accurate at the time of production, but no warranty of accuracy is given, and no liability in respect of any error or omission is accepted. It should be noted that investment involves risks, the value of investments and the income from them may fluctuate in accordance with market conditions and taxation agreements and investors may not get back the full amount invested. Both past performance and yields are not reliable indicators of current and future results. Diversification does not protect against loss of principal.
Acumen Wealth Advisors, LLC® is a Registered Investment Adviser. Advisory services are only offered to clients or prospective clients where Acumen Wealth Advisors, LLC® and its representatives are properly licensed or exempt from licensure. Past performance is no guarantee of future returns. Investing involves risk and possible loss of principal capital. No advice may be rendered by Acumen Wealth Advisors, LLC® unless a client service agreement is in place.