Acumen’s Q3 2019 Market Commentary

Where We Were
During the final days of the second quarter in 2019, the Federal Open Market Committee (FOMC) began its policy pivot – suggesting an easy money environment. This policy change came on the legs of a first half seeing the stock market, yet again, scale the wall of worry created by Eurozone economic weakness and a diminishing relationship between the world’s two largest economies. The Fed consistently referred to this policy change as an “insurance policy” that was being taken out as a result of signs of global weakness. The first cut came on 7/31/2019 which was the first since 2008. Despite optimism for easier business investment and capital expenditure opportunities, the Federal Open Market Committee’s efforts were upended by an additional round of tariffs on Chinese imports while policy makers were hoping to steepen the yield curve, reduce upward pressure on the dollar, and bolster economic confidence via modest rate cuts. The trade war largely foiled many monetary policy officials’ plans. As a result, the first half of the third quarter was filled with volatility, the tabling of “risk-on”, and negatively performing stocks globally. However, the second half of the third quarter provided a different narrative, as a second FOMC rate cut was met with newfound optimism in the United States and China trade dispute and leading economic indicators within the U.S. remained steadfast.
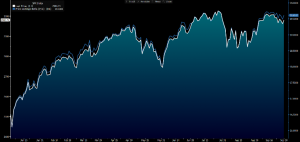
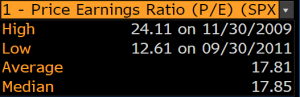
Figure 1 displays the performance of the S&P 500 year to date. On the right side of the chart is a measure of the index’s Price to Earnings (P/E) ratio displayed in the blue line. As you can see from the most recent time frame on the chart, the index’s P/E ratio ended the third quarter at 19.6102, while the 10-year average is 17.81 and the median for the same time period is 17.85 (as displayed in Figure 2). While equity prices should not primarily be viewed as “overvalued”, it is fair to say they are currently reflecting fair market value, as fundamental measures have regained fair market value after a decent correction in price occurring at the beginning of the third quarter.
Where We Are
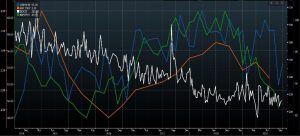
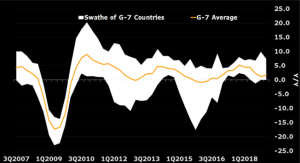
The fourth quarter of 2019 will be primarily focused on two major themes affecting asset classes across the entire spectrum. The first theme is a dispute on global trade with the second theme being global monetary policy and how it changes and shifts to offset the drag of trade disputes as well as slowing global economic growth. Regarding the current trade war between the United States and China, the most recent update claims of renewed talks between the two countries beginning again in October. These discussions between both countries trying to reach an agreement are essential, as we have continued to see cracks develop in global economies and have begun to see the beginnings of cracks here at home. Globally, Germany has entered a full-blown recessionary environment, Chinese economic data is beginning to show weakness, and the United States has technically entered a manufacturing recession – with the Purchasing Manager’s Index below 50.0 (displayed in green in Figure 3). One of the primary reasons the United States has yet to enter complete recession territory, is the activity on the consumer side. Displayed in Figure 3 is a blue line charting consumer sentiment measured by the University of Michigan – a leading economic indicator. The consumer has continued to hold up the economy on its last legs of this expansion. However, the more volatile the pattern of trade legislation becomes, the consumer and the household may swing from spending to saving. We have already noticed slowing in business spending and business investment. Figure 4 displays a marked slowdown in business investment growth (year over year) across the G-7 economies. The trade war does not only affect companies directly, but also indirectly, as uncertainty increased the cost of capital – requiring a much higher rate of return required for a business or even an individual to undertake an investment.
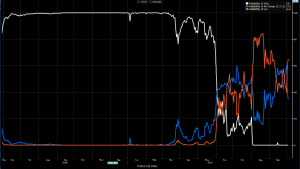
Global monetary policy is doing its best to offset some of the drag we are beginning to see. The Federal Reserve, the European Central Bank, and the People’s Bank of China are all currently in monetary easing patterns and are expected to continue to do so. During mid-September, Federal Reserve Chairman Jerome Powell cited “slower growth abroad and trade policy developments” as the rationale for cutting the central bank’s benchmark rate by a quarter percentage point, to a range between 1.75% and 2%. This pattern is expected to grow as shown in the Current Implied Interest Rate Probability charted in Figure 5. There is now a 65% chance of another interest cut (orange) against a 35% chance of no change (blue). This expansion is now 11 years old and is still not fully displaying late cycle characteristics, such as high inflation or elevated interest rates, even though wage pressures have begun to accelerate in response to a very tight labor market (charted in white in Figure 3), and sectors that are centered around personal consumption are still growing. In an attempt to provide a soft landing for the U.S. economy in its 11th year of an expansion, Global monetary policy doves have recently prevailed with rate cuts. Reasons for this insurance policy have been cited as: trade tensions, newly developed domestic political uncertainty, Brexit, falling manufacturing activity, faltering business investment, and a volatile market turning with the U.S.-China trade war. However, the hawks see the cup half-full. The U.S. and Japan, two of the three largest economies in the world, are sustaining modest growth (U.S. GDP is plotted in orange in Figure 5), unemployment continues to maintain its all-time-low, consumer and service sectors, accounting for more economic activity than factories, are continuing to hold up well, and the geopolitical concerns that have shaken markets could be on the brink of dissipation.
Where We Are Heading
Current economic data and Fed officials’ outlook suggests a slowing global environment, but a recession seems more further out than near. Furthermore, it appears the Federal Reserve will continue its transition into policy containing additional rate cuts to provide further insurance to push out a potential recession. As a result of a volatile trade dispute between the world’s two largest economies, a slowdown within the Eurozone, and political instability abroad, second-half growth forecasts should be lowered to the 1.8 – 2.0 range in the fourth quarter, bringing full-year 2019 growth to approximately 2.3%. Many of the monetary policy decisions being currently made mirror the 1990’s. In 1990, the Federal Reserve began increasing interest rates, and did so seven times, all the way until 1995. They then began cutting rates during a period of modestly increasing GDP. With this noted, the economy is not the stock market, but can be used as a precursor to understand when to make strategic moves in portfolios. These rate cuts are what most economists believe allowed the United States to continue its economic expansion throughout the entire decade, when it hit hard growth headwinds halfway through this time period. Important to note, as sometimes it is hard to see through the noise such as: heightened political tensions, overly exuberant or pessimistic economists, analysts fueled by self-interest, and the second tier on Maslow’s Hierarchy of Needs – Safety, which can sometimes take shape of financial stability.
Since 1980, and not including 2019, the Federal Reserve has provided interest rate cuts 17 times when the S&P 500 was trading within 2% of all-time highs. One year later, the S&P 500 was higher in all 17 periods with the average return in the following year equaling 15%. Don’t fight the Fed. The path to successful investing is rarely as smooth as we would prefer. Headwinds and speedbumps come in many different forms and cause investors to constantly question allocations. As investors, we often desire the logical course of action to weather a recession or market correction. However, as humans, seeing portfolio values fall often sparks panic and irrational behavior. It is times like now when it is important to remember markets have been tested before, and there is a time-tested strategic allocation model adhering to remain invested in the market when others flee. Remember, as mentioned in our previous newsletter on “Staying Invested”, the average time it takes for an annual correction year to be met with a positive year is 1.50 years. In saying this, Acumen’s Portfolio Management Committee is prepared to make strategic investment decisions in the near future due to changing market dynamics on the horizon. Acumen’s Portfolio Management team strongly believes the best strategy for weathering volatile markets is adhering to a strategy focused on maintaining market exposure through strategic management within asset class allocations using a mix of top-down macroeconomic analysis and fundamental investment decisions.
Regards,
Grant Allen, Portfolio Analyst
Information used in this commentary, along with any graphs created, was from material obtained via Bloomberg L.P.
The opinions expressed in this commentary should not be considered as fact. Information contained herein is not and should not be construed as an offer, solicitation, or recommendation to buy or sell securities. The information has been obtained from sources we believe to be reliable; however, no guarantee is made or implied with respect to its accuracy, timeliness, or completeness. It is suggested that you consult your financial professional, attorney, or tax advisor with regard to your individual situation. Comments concerning the past performance are not intended to be forward looking and should not be viewed as an indication of future results. Diversification does not protect against loss of principal. Any charts, graphs, and descriptions of investment and market history and performance contained herein are not a representation that such history or performance will continue in the future or that any investment scenario or performance will even be similar to such chart, graph, or description.
The Federal Open Market Committee (FOMC) is the monetary policymaking body of the Federal Reserve System. The FOMC is composed of 12 members-the seven members of the Board of Governors and five of the 12 Reserve Bank presidents.
The S&P 500 Index is widely regarded as the best single gauge of the U.S. equities market. The index includes a representative sample of 500 leading companies in leading industries of the U.S. economy. All indexes are unmanaged, and an individual cannot invest directly in an index. Index returns do not include fees or expenses.
Price to forward earnings is a measure of the price-to-earnings ratio (P/E) using forecasted earnings.
Acumen Wealth Advisors, LLC® is a Registered Investment Adviser. Advisory services are only offered to clients or prospective clients where Acumen Wealth Advisors, LLC® and its representatives are properly licensed or exempt from licensure. Past performance is no guarantee of future returns. Investing involves risk and possible loss of principal capital. No advice may be rendered by Acumen Wealth Advisors, LLC® unless a client service agreement is in place.