Q1 2021 Market Commentary

First Quarter Recap
The first quarter brought political change and increased optimism that reprieve from the global pandemic is within reach. President Biden assumed office with a Democrat-controlled legislature, Congress passed a $1.9 trillion stimulus package, and vaccine distribution accelerated across the country with nearly 100 million Americans receiving at least one dose. New daily Covid cases peaked at the beginning of January before rapidly declining through March, and states continued lifting restrictions allowing businesses to welcome more customers in person.
The Bureau of Labor Statistics reported the U.S. added 916,000 jobs in March, and the unemployment rate declined to 6.0% (down from last April’s rate of 14.8%) with leisure and hospitality posting the largest gains. The Consumer Confidence Index (CCI) from the Conference Board reached its highest level since the beginning of the pandemic. Also, business sentiment, measured by the Institute of Supply Management’s Manufacturing Purchasing Managers Index (PMI), registered its highest reading since 1983. Demand for manufacturing industries was strong as the recovery gained a foothold. But supply and labor constraints caused some pricing pressures; as a result, inflation indicators are likely to rise in the coming months especially as prices are compared to last year’s price levels which were driven lower by the pandemic. Despite all of this positive momentum, the Federal Reserve committed to remaining accommodative to support the recovery by leaving rates low and continuing asset purchases until further progress is made towards full employment.
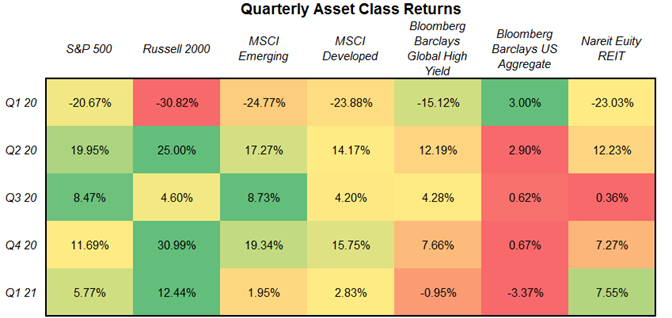
Cyclical sectors, such as energy and financials, continued their outperformance in the first quarter as the outlook for economically sensitive industries improved. The second round of direct payments will likely help spur consumption as businesses reopen and consumers have extra cash from the stimulus and higher savings rates. Among asset classes, small cap equities and real estate outperformed as investors priced in a robust economic recovery for 2021. Investors trimmed their holdings in large technology companies and other crowded trades as analysts had to assess whether future earnings growth could support all-time high valuations or if earnings had been pulled forward due to Covid trends. Still, U.S. equity valuations remain above their historical averages with the S&P 500 up nearly 6% in the first quarter. These valuations underline the need for portfolio diversification and careful security selection.
Outlook
While we attempt to steer clear of making matter of fact statements about what WILL happen, we believe investors must be aware of the current environment and where it is likely to lead us. This, of course, is how we derive our investment thesis and position portfolios. We remain objective about the range of possibilities, assigning probabilities, and diversifying amongst them to generate the best risk-adjusted return. We believe there are a few possibilities in this current environment that have higher probabilities than others. For one, from a top-down perspective, we believe equities will outperform bonds. Our research tells us we are at the start of a new economic expansion, while the monetary policy framework, adopted during 2020, has brought us to 2021 with historically low interest rates. During the fourth quarter of last year, when the world was on the verge of opening again due to positive vaccine news, we decided to underweight fixed income relative to target-weight in client portfolios. We believed drawing closer to the reopening of the global economy would cause nominal bond yields to move drastically higher.
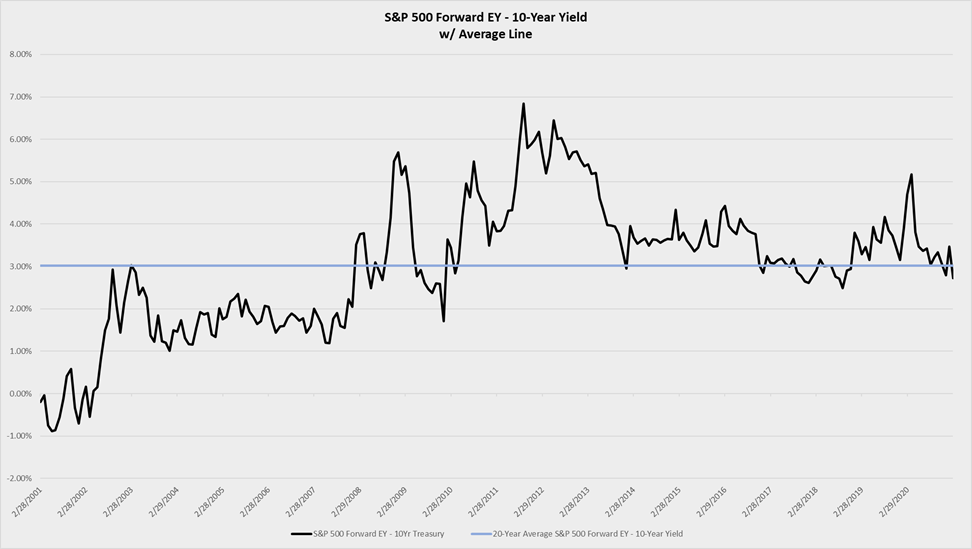
When yields move up, the price of bonds go down, which then generates a negative return. We continue to hold the view bond investors will receive a lower return than what they have historically experienced, and higher inflationary pressures will generate negative real returns for bond investors. However, we adhere to the idea bonds play a key role in portfolio construction across longer time horizons, and another dramatic move in interest rates could create attractive buying opportunities. While we have remained underweight in fixed income, we do not currently believe in significantly overweighting equities. Our belief is there must be both a top-down reason and bottom-up reason for significantly overweighting an asset or asset class. While the new economic expansion and easy monetary policy provides an optimistic backdrop for global equities, their valuations cause them to be expensive. We like to use the Federal Model to value equities relative to bonds. This measure takes the reciprocal of the Price/Earnings ratio, generating an Earnings Yield, and compares the ratio to the yield investors receive on a risk-free bond – typically the 10-Year Treasury. When the Earnings Yield for stocks is greater than the yield investors are getting on their respective risk-free bond, then stocks are relatively attractive, as is the case today. In the chart below, we can see the Earnings Yield for the S&P 500 minus the 10-Year Treasury Yield. While the spread between the two is currently positive, signaling attractive valuation for stocks relative to bonds, the measure is below its 20-year average line.
While stocks are relatively attractive to bonds, they are expensive on an absolute basis when we look at other measures such as the Price/Earnings ratio, or the Cyclically Adjusted Price to Earnings (CAPE) ratio. We have also attempted to diversify some of this risk by investing more heavily in international stocks, and emerging market stocks. These stocks have valuations which are less extreme and have tailwinds if we see higher inflationary pressures. If we are underweight in fixed income, but not overweight in equities, then where do we believe investors should invest the rest of their capital? We have looked to alternative assets, typically having much lower correlations to the broad equity market, to look for both opportunities and diversification benefits. Even within the equity allocation in client portfolios, we have a targeted allocation to real estate which has historically displayed lower correlation to the rest of the equity market and a higher correlation to economic growth. Other areas of the market we consider alternatives are commodities and hedged equity. These alternatives are exposures in portfolios we find provide greater downside protection in periods of heightened volatility. We believe volatility will be a key player over the next few years since we have seen political uncertainty rise across the globe and financial assets are priced richly. To us, coupled with a positive macroeconomic backdrop, this volatility will generate substantial buying opportunities as did the Covid pandemic generated within financial markets in 2020.
To learn more about how Acumen can help you Invest Intentionally®, please contact us.
Information and charts used in this commentary was obtained via Bloomberg L.P.
The opinions expressed in this commentary should not be considered as fact. All opinions expressed are as of the published date and are subject to change. Information contained herein is not and should not be construed as an offer, solicitation, or recommendation to buy or sell securities. Investments in securities involves risk, will fluctuate in price, and may result in losses. The information has been obtained from sources we believe to be reliable; however no guarantee is made or implied with respect to its accuracy, timeliness, or completeness. It is suggested that you consult your financial professional, attorney, or tax advisor with regard to your individual situation. Comments concerning the past performance are not intended to be forward looking and should not be viewed as an indication of future results. Diversification does not protect against loss of principal.
Any charts, graphs, and descriptions of investment and market history and performance contained herein are not a representation that such history or performance will continue in the future or that any investment scenario or performance will even be similar to such chart, graph, or description.
The S&P 500 Index is widely regarded as the best single gauge of the U.S. equities market. The index includes a representative sample of 500 leading companies in leading industries of the U.S. economy. The S&P 500 Index focuses on the large-cap segment of the market; however, since it includes a significant portion of the total value of the market, it also represents the market. The Russell 2000 Index® measures the performance of the 2,000 smallest companies in the Russell 3000 Index. The MSCI Emerging Markets Index is a free float-adjusted market capitalization index that is designed to measure equity market performance in the global emerging markets. The MSCI EAFE Index (Europe, Australasia, Far East) is a free float-adjusted market capitalization index that is designed to measure the equity market performance of developed markets, excluding the US & Canada. The Bloomberg Barclays Global High Yield Index is a multi-currency flagship measure of the global high yield debt market. The index represents the union of the US High Yield, the Pan-European High Yield, and Emerging Markets (EM) Hard Currency High Yield Indices. The Bloomberg Barclays Aggregate Bond Index is an index used by bond traders, mutual funds, and ETFs as a benchmark to measure their relative performance. The index is broadly considered to be the best total market bond index, as it is used by more than 90% of investors in the United States. The FTSE Nareit All Equity REITs Index is a free-float adjusted, market capitalization-weighted index of U.S. equity REITs. Constituents of the index include all tax-qualified REITs with more than 50 percent of total assets in qualifying real estate assets other than mortgages secured by real property.
The Purchasing Managers Index (PMI) is a measure of the prevailing direction of economic trends in manufacturing. The PMI is based on a monthly survey of supply chain managers across 19 industries, covering both upstream and downstream activity. Price to forward earnings is a measure of the price-to-earnings ratio (P/E) using forecasted earnings. The Consumer Confidence Index (CCI) is a survey, administered by The Conference Board, that measures how optimistic or pessimistic consumers are regarding their expected financial situation. The CCI is based on the premise that if consumers are optimistic, they will spend more and stimulate the economy but if they are pessimistic then their spending patterns could lead to a recession. The CAPE ratio is a valuation measure that uses real earnings per share (EPS) over a 10-year period to smooth out fluctuations in corporate profits that occur over different periods of a business cycle.
Acumen Wealth Advisors, LLC® is a Registered Investment Adviser. Advisory services are only offered to clients or prospective clients where Acumen Wealth Advisors, LLC® and its representatives are properly licensed or exempt from licensure. Past performance is no guarantee of future returns. Investing involves risk and possible loss of principal capital. No advice may be rendered by Acumen Wealth Advisors, LLC® unless a client service agreement is in place.