Q3 2021 Market Commentary

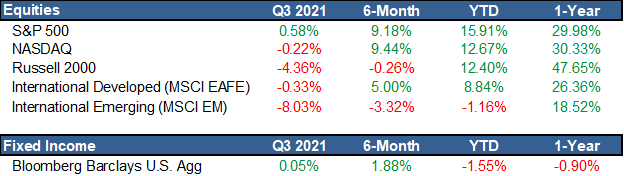
During the last 18 months, we have become accustomed to pessimistic narratives. And, while the third quarter of this year didn’t include a new pandemic, revived social unrest, or Prince Harry and Meghan Markle leaving the royal family, the NUMBER of pessimistic narratives surrounding the third quarter was significant. Volatility across foreign policy, the Delta wave, supply shortages, and the debt ceiling debate, all contributed to a stock market (S&P 500) that was up approximately a half of a percent and a bond market (Bloomberg Barclays U.S. Agg) that was flat in the third quarter. While a look at the third quarter might provide a negative view for financial markets volatility was actually introduced in September as the S&P 500 fell more than 4% during the month. However, we are reminded there was an average drawdown of close to 14% every year since 1980 in the S&P 500[1], and we believe the bull market, started on March 23rd of 2020, is still intact. Below, we outline our view on major topics surrounding financial markets today.
Economic Growth
One variable, used to help construct our outlook on future economic growth, is leading economic indicators. Leading indicators are economic datapoints tending to move before major changes in the business cycle. Changes in the business cycle can have drastic implications for how we allocate assets. We like to use a basket of leading indicators constructed by the Conference Board – the Leading Economic Index (LEI). The LEI has continued to advance and continues to create a constructive outlook for economic growth. However, one important point we believe should be noted is the upward rate of change has begun to slow. This change causes us to believe we could be transitioning from an early expansion phase of the business cycle to a more mature phase of the business cycle. Other indicators of economic growth support this view as well. While we believe the level of economic growth will continue to increase, there is evidence the rate of change will slow over the next 12 to 18 months. This slowdown/decrease has implications on our asset allocation. With the transition of the business cycle from an early expansion to mature, the market will typically not be able to digest volatility as well. But we typically do not see sustained bear markets without a transition in the business cycle from a period of growth to a period of decline.
Inflation
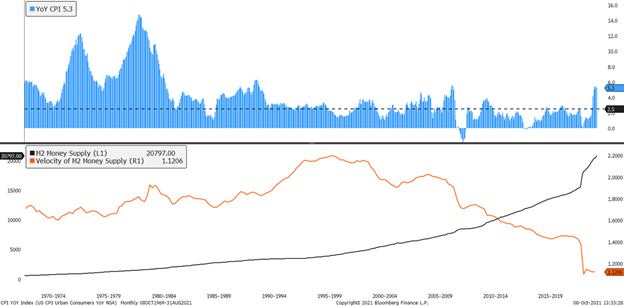
The original catalyst for the idea of higher inflation was the increase in government deficits across most major economies driven by large amounts of stimulus. At the same time, the Federal Reserve changed its policy framework to allow for higher inflation in the short-term. This unfamiliar policy shift, coupled with the idea that pent up demand would cause supply bottlenecks, caused inflation to become the most hotly debated topic amongst investors and economists. While we believed supply chain disruptions would cause short- to medium-term higher inflation, we adhered to the idea high inflation would not become a structural problem. Current inflation readings have been higher than the long-term average, as we have seen major supply chain disruptions. We believe a few reasons for the disruptions across supply chains are the reliance on Just in Time inventory, a greater need on a globalized supply chain in today’s world, and the labor market dynamics of higher unemployment as demand has surged post Covid lockdowns. Our opinion remains that these pressures will subside as labor market dynamics heal and the surge in demand subsides. Our long-term view remains; there are too many structural headwinds to higher inflation – two of which are aging demographics across major economies and the further adoption of technology in the modern economy. However, we believe the most important factor causing inflation to be transitory is recent history telling us higher government deficits are a drag on growth and, as a result, inflation. While higher debt and stimulus may provide a sugar high for a moment, the long-term effects have been largely disinflationary. We believe inflation cannot become a long-term factor unless we see the Velocity of Money increase – the measurement of the rate at which money is exchanged in an economy. This variable has been falling for years as banks have been disincentivized to lend more capital. This relationship can be seen from the deviation in loans and deposits in major banks. While headline inflation readings have risen to their highest levels in over a decade, we have started to see them begin to cool over the previous two months. We have some tactical allocations to asset classes that do better in an inflationary environment, but our long-term outlook for inflation has kept us from changing portfolio allocations in a sizable way to be geared more toward a higher inflationary environment.
Asset Class Views
After a more volatile third quarter, major stock indices are still up more than 10% for the year. We believe the equity market is still showing a green light due to various fundamental factors. Positive economic growth, relative valuations to bonds, and high forecasted earnings growth all create a positive backdrop for equity performance over the next 12 to18 months. Risks to this outlook are the relatively high valuations from a historical perspective that equities show and the withdraw of Monetary Policy support many speculate could happen soon. Typically, the withdrawal of Monetary Policy will compress the premium investors are willing to pay for equities, and this leads to downside in equity prices when corporate profits are not growing. Today, while the decrease in Monetary Policy could create some headwinds for equities, we believe investors should be positioned at their target weight for equities as expected earnings growth is higher than what we typically see. Within equity allocations, we see a reason to be slightly overweight in International Equities, as valuations look much less stretched across the space than for Domestic Equities. We continue to favor an overweight to high quality companies with long-term earnings growth, and we believe a portion of equity allocations should be to areas doing better when economic growth is strong, and inflation is higher – such as Small Cap Equities and real estate. Overall, we are neutral weight to equities as a whole and have a slight defensive tilt toward high quality and lower beta[2].
Our outlook for bonds continues to be less constructive and we remain underweight in Fixed Income relative to targets. While yields have risen during 2021, they remain at all-time lows across maturities; there is a direct correlation in the total return investors have made across the Fixed Income market over the previous 40 to 50 years and the level of yields. This relationship can be seen in the chart below comparing the 10-Year Yield with the 5-Year Total Return for the Bloomberg Barclays U.S. Aggregate Bond Index over the last 45 years. One area we tend to deviate from conventional thinking amongst investors is that most have positioned bond allocations for rising interest rates. However, we believe rates will continue to fall in the long-term, which is why we have been buyers of the recent rise in interest rates during the year. Our outlook is moderating growth and inflation will begin to create a backdrop for lower rates. Since the United States is one of the only major economies with positive interest rates, drawing investors in could be a major catalyst for lower rates as well. Consequently, while we are underweight in fixed income, we have been lengthening duration in fixed income allocations to take advantage of higher rates in the short-term.
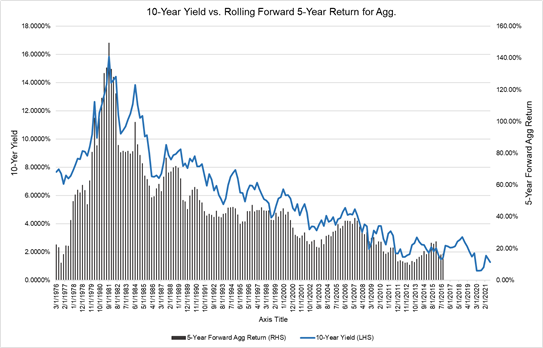
Chart created via Bloomberg, L.P. as of 8/31/2021.
The opinions expressed in this commentary should not be considered as fact. All opinions expressed are as of the published date and are subject to change. Information contained herein is not and should not be construed as an offer, solicitation, or recommendation to buy or sell securities. Investments in securities involves risk, will fluctuate in price, and may result in losses. The information has been obtained from sources we believe to be reliable; however no guarantee is made or implied with respect to its accuracy, timeliness, or completeness. It is suggested you consult your financial professional, attorney, or tax advisor with regard to your individual situation. Comments concerning the past performance are not intended to be forward looking and should not be viewed as an indication of future results. Diversification does not protect against loss of principal.
The S&P 500 Index is widely regarded as the best single gauge of the U.S. equities market. The index includes a representative sample of 500 leading companies in leading industries of the U.S. economy. The S&P 500 Index focuses on the large-cap segment of the market; however, since it includes a significant portion of the total value of the market, it also represents the market. The Nasdaq Composite is a stock market index that includes almost all stocks listed on the Nasdaq stock exchange. Along with the Dow Jones Industrial Average and S&P 500, it is one of the three most followed stock market indices in the United States. The Russell 2000 Index® measures the performance of the 2,000 smallest companies in the Russell 3000 Index. The MSCI EAFE Index (Europe, Australasia, Far East) is a free float-adjusted market capitalization index that is designed to measure the equity market performance of developed markets, excluding the US & Canada. The MSCI Emerging Markets Index is a free float-adjusted market capitalization index that is designed to measure equity market performance in the global emerging markets. The Bloomberg Barclays Intermediate US Government/Credit Bond Index is a broad-based flagship benchmark that measures the non-securitized component of the US Aggregate Index with less than 10 years to maturity. The Composite Index of Leading Indicators, otherwise known as the Leading Economic Index (LEI), is an index published monthly by The Conference Board. It is used to predict the direction of global economic movements in future months. The Index is composed of 10 economic components whose changes tend to precede changes in the overall economy
All indexes are unmanaged and an individual cannot invest directly in an index. Index returns do not include fees or expenses.
Any charts, graphs, and descriptions of investment and market history and performance contained herein are not a representation that such history or performance will continue in the future or that any investment scenario or performance will even be similar to such chart, graph, or description.
Acumen Wealth Advisors, LLC® is a Registered Investment Adviser. Advisory services are only offered to clients or prospective clients where Acumen Wealth Advisors, LLC® and its representatives are properly licensed or exempt from licensure. Past performance is no guarantee of future returns. Investing involves risk and possible loss of principal capital. No advice may be rendered by Acumen Wealth Advisors, LLC® unless a client service agreement is in place.
[1] Source: https://fulfillment.lordabbett.com/file/16cc35ecc5b8ad2d36de025222fcca40/filename/Volatility_Brochure#:~:text=In%20fact%2C%20in%20any%20given,Index%20historically%20has%20been%2014%25
[2] Beta is a measure of the volatility—or systematic risk—of a security or portfolio compared to the market as a whole.