Q4 2020 Commentary

2020 Recap
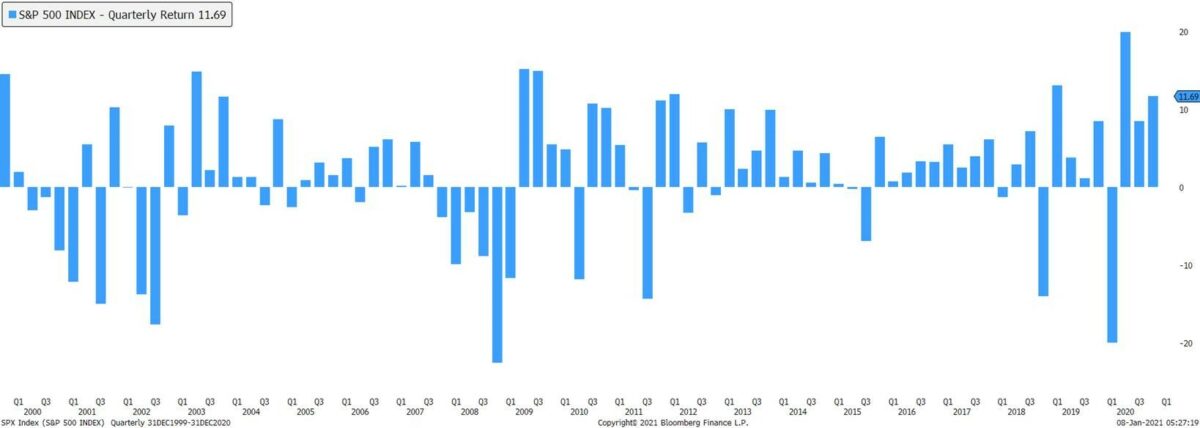
We recently read a quote stating, “2020 is like looking both ways before crossing the street and then getting hit by an airplane.” No matter how cautious we were, it seems we could not escape the impact of the most challenging year in our recent history. It was a year to be remembered, first as a health care crisis, and then for the first ever complete halting of global economic activity brought on purposefully by governments due to the pandemic. It should also be remembered as a tale of two recoveries. The first recovery was slow and sluggish and still has not recovered to its previous level which is the recovery of global economic activity. While the incongruously high levels of jobless claims and absurdly low levels of consumer spending have trended back in the right direction, the recent rate of change has stagnated while waiting for the pandemic to come to its end. The second recovery can be seen in prices of riskier assets, which caught most investors by surprise given the economic circumstances. It was swift and, if you blinked, you could have missed it. We saw the second largest quarterly drawdown over the last 20 years in the S&P 500 (which was essentially matched across various other equity indices), followed by the largest quarterly increase, and the two subsequent quarters which were well above the quarterly average return of 1.64%. As shown below, during this recovery, we also saw the spreads of High-Yield (junk) Bonds over Treasuries compress to levels far below their average, and other speculative assets, such as SPACs and Bitcoin, produced parabolic returns. The contrast of performance of these assets in the first quarter of 2020, relative to which was seen in the following three, was not only unique in its speed, but also in the fundamentals driving the rally.
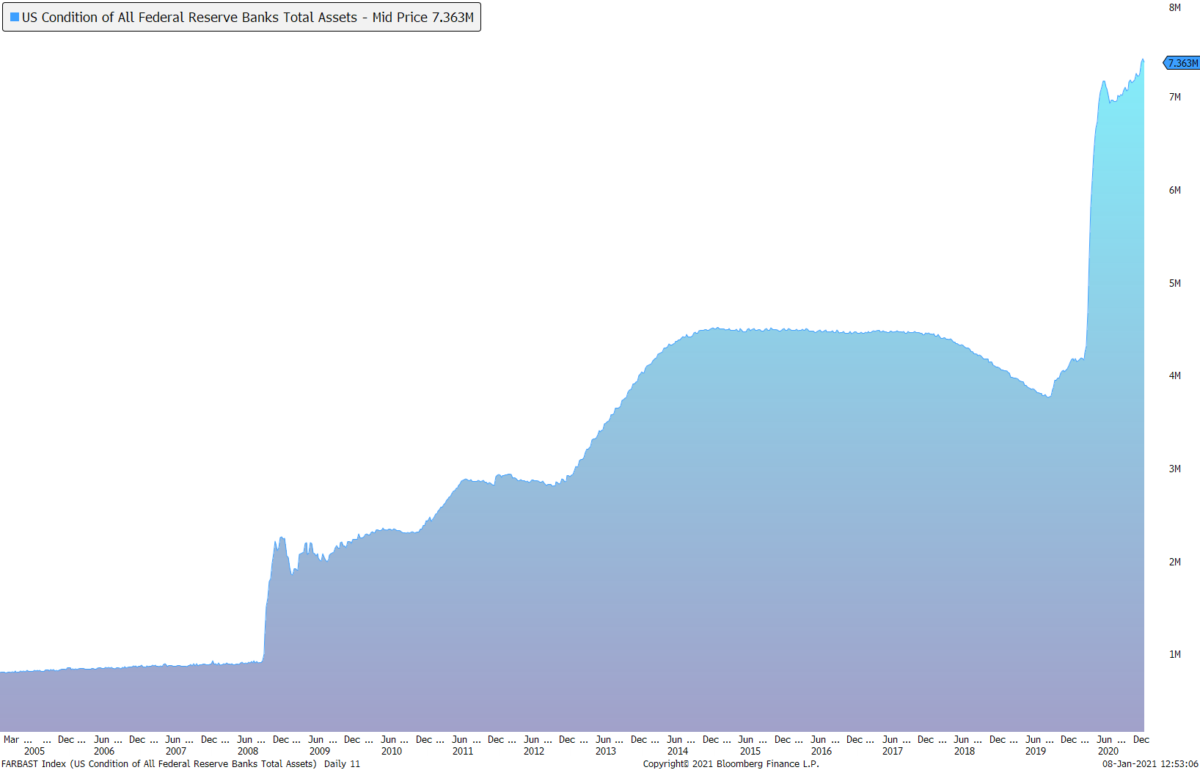
During February and March, investors divested riskier assets, such as equities and lower-rated corporate credit, and flocked to cash and treasuries. The U.S. Dollar Index (DXY) appreciated more than 8% in just ten days – a move incredibly atypical for currency markets. Almost every other financial asset suffered wide losses as liquidity completely evaporated. Even investment-grade corporate bonds with the lowest default rates could not be offloaded fast enough. This selloff happened as investors began digesting a complete stop in economic activity. Just a month later, the dynamics of the global economy became much easier for investors to understand. First, the continuous news flow on progress made in understanding and treating the virus gave investors optimism. The second dynamic was just how likely the sharp change in asset prices was in such a short amount of time. The CBOE Volatility Index (VIX) completely blew through previous highs and asset valuations were incredibly attractive, giving many investors comfort in weathering the coming future storm through the second half of the year with the pandemic. Lastly, and the one which we believe is the most important to understand what happened in 2020 and what we are most closely watching in 2021, fiscal and monetary policies provided both protection and liquidity to financial markets and consumers. In the matter of four months (2/26/2020 – 6/10/2020), the U.S. Federal Reserve increased its balance sheet by more than $3 trillion. Stepping way outside of their typical mandate, they began buying up financial assets (even corporate bonds) and propping up financial markets with massive amounts of liquidity. Even a global pandemic, which had not matured to its fullest threat, could not keep investors on the sidelines with the level of support from central banks. This action was not limited to just the United States since central banks across the globe joined in. In the United States, fiscal policymakers stepped in by providing financial support to struggling businesses, the unemployed, and even the employed with direct payments to boost consumer spending.
The fourth quarter was a different story. Once again, cases were on the rise across the globe and new lockdowns were following. In the United States, we faced one of the most volatile election seasons imaginable, and many were curious if we would even know the true result of the election until months after election day. Election day passed and markets reacted positively to both the initial results which showed the potential for gridlock in Washington and to positive vaccine news. While October presented a negative return for most risk assets, November and December carried a 16.7% rally in the S&P 500. This rally also breathed life into sectors and assets which had lagged by miles through the first ten months of the year. Sectors, such as financials and energy, commodity markets, and other cyclically sensitive assets, regained some relative strength against what had shown momentum previously. Sudden vaccine optimism, accommodative monetary and fiscal policy, an even more fiscally accommodative administration now up to bat, and the lack of opportunities to find yield, lit a massive spark across financial markets for a new “reflation trade”. This reflationary thesis is the thought 2021 will bring a resumption to normalcy, even more liquidity, and higher global growth than we experienced even before the pandemic.
2021 Outlook
In an attempt to shy away from prognosticating the absolute direction of financial markets, which we believe is ultimately impossible, we want to provide possible trends or possibilities for financial markets in 2021. These are the factors we are keeping a keen eye, and the ideas we think could have the largest effect on financial assets over the medium and long term. We prefer to keep clients well-diversified and exposed to the market because we believe it is quite difficult to predict with 100% accuracy and even harder to time. However, we make tactical allocations and tilts based on the opportunities, risks, and trends we see and our understanding of their probabilities. We are watching the following:
- Fiscal and Monetary Policy should continue to be ultimately well-accommodative in 2021. The Federal Reserve has given no inkling of deciding to slow down its asset purchasing program. They are currently purchasing over $100 billion in assets every month to provide liquidity to financial markets and, if they keep this purchase up for 2021, we will see more than another $1 trillion added to the balance sheet. From a fiscal perspective, the new administration will likely usher in more stimulus and aid to the consumer and businesses, and we could be well on our way to fully experiencing Modern Monetary Theory in action. In the short to medium term, we believe this is ultimately bullish for riskier financial assets like equities. In the long term, we could see some adverse effects of a massive debt overhang.
- Vaccines will likely be the star of the show in 2021. Three vaccines have been approved for full use, with two currently being widely distributed across the United States. Current market prices have assumed there will be widespread voluntary inoculation with no adverse effects.
- Valuations going into 2021 are higher than what we have historically seen, mostly across all asset types. These valuations, specifically in the equity market, need to be supported by earnings growth across the global economy. The current premium investors are paying for more economically sensitive assets can probably be supported by current interest rates and liquidity, but an expansion in the premium is unlikely, and earnings will have to catch up.
- Inflation is probably one of the biggest trends to pay attention to in 2021. In fact, the weaker U.S. dollar, overweight cyclical sector, and global economic growth reflation investment thesis might be the most crowded. This weakening of the dollar does not mean it is wrong. We believe the deficit and previous overvaluation of the U.S. dollar could continue the current trend, but the large inflationary pressures are simply impossible to find without an increase in the velocity of money. This pressure means people need to spend the dollars injected into the economy.
- We are paying particular attention to the trends in 2021 of the continued dominance of the technology sector and the new developments across technology and healthcare. While we do not prefer to largely overweight the crowded trade of Large Cap technologies, we believe an overweight to the technology and healthcare sectors is the correct positioning for the long term. We have continued to focus on the disruption beginning before the pandemic which has likely been exacerbated by the experiences in 2020. Genomics across the healthcare sector is one of these areas we believe gives investors access to exponential growth opportunities and diversification from the broad equity market.
To learn more about how Acumen can help you Invest Intentionally®, please contact us.
Information used in this commentary was obtained via Bloomberg L.P.
The opinions expressed in this commentary should not be considered as fact. All opinions expressed are as of the published date and are subject to change. Information contained herein is not and should not be construed as an offer, solicitation, or recommendation to buy or sell securities. Investments in securities involves risk, will fluctuate in price, and may result in losses. The information has been obtained from sources we believe to be reliable; however no guarantee is made or implied with respect to its accuracy, timeliness, or completeness. It is suggested that you consult your financial professional, attorney, or tax advisor with regard to your individual situation. Comments concerning the past performance are not intended to be forward looking and should not be viewed as an indication of future results. Diversification does not protect against loss of principal.
Any charts, graphs, and descriptions of investment and market history and performance contained herein are not a representation that such history or performance will continue in the future or that any investment scenario or performance will even be similar to such chart, graph, or description.
All indexes are unmanaged and an individual cannot invest directly in an index. Index returns do not include fees or expenses.
Definitions
The S&P 500 Index is widely regarded as the best single gauge of the U.S. equities market. The index includes a representative sample of 500 leading companies in leading industries of the U.S. economy. The S&P 500 Index focuses on the large-cap segment of the market; however, since it includes a significant portion of the total value of the market, it also represents the market. Created by the Chicago Broad Options Exchange (CBOE), the Volatility Index, or VIX, is a real-time market index that represents the market’s expectation of 30-day forward-looking volatility. Derived from the price inputs of the S&P 500 index options, it provides a measure of market risk and investors’ sentiments. The U.S. Dollar Index (DXY) is a measure of the value of the United States Dollar (USD) against a weighted basket of currencies used by US trade partners.