Acumen Market Insights: Importance of EPS & PE Ratio

The two most commonly reported numbers measuring a company’s performance each quarter are Sales and Earnings Per Share (EPS) also known as the top and bottom line. Sales are preferred by analysts because it’s the starting point and EPS is a lot easier to manipulate by deciding when to realize expenses or tax consequences. EPS is more useful than sales, even if it contains a lot more noise, because it has useful sub-calculations such as profit margin already embedded in it. One of the most basic methods people can discuss regarding a value for stocks is to divide the price of the stock by the EPS of the company – the PE or Price to Earnings ratio. These valuations over time are somewhat smoother than just looking at price because, while price changes every day, earnings are only updated once a quarter. Barring great surprises, stocks which have been moving higher all quarter will announce higher earnings and, as you would expect, underperforming stocks tend to lower earnings. Over long enough timeframes, the ratio of Price to Earnings tends to stay within a reasonable range. This range is different for every company, of course, but the aggregated stock market range is talked about often. It is easy to conceptualize the idea of valuation multiples. It’s called a multiple because the price is typically several times the EPS.
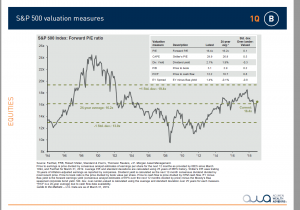
In the above example from JPMorgan, the forward PE is charted, meaning it is plotting the price divided by the estimated next 12 months of earnings for every company in the S&P 500. Also plotted on the chart, is the standard deviation which is indicating 68% of all readings should land within 1 standard deviation above or below. On the chart, anywhere from 13.0x to 19.4x is the range. No system is perfect. One potential flaw using forward PE ratios is it is based on consensus earnings estimates. What if the consensus is wrong?
We believe fourth quarter earnings estimates for the S&P 500 are still too high. Some recent aggregated S&P 500 sales and EPS numbers from Bloomberg are as follows:
| 4Q18 | 1Q19 | 2Q19 | 3Q19 | 4Q19 | |
| S&P 500 Aggregate Sales growth | 6.00% | 4.20% | 4.40% | 5.20% | 4.70% |
| S&P 500 Aggregate EPS growth | 12.60% | -9.90% | 0.60% | 1.50% | 7.60% |
*Bloomberg estimates (21/498 reported)
Because the sales estimates for 2019 are all relatively even for each quarter, the fourth quarter number for EPS looks suspect. The first three quarters seem more normal with sales growing faster than earnings. It is possible to smooth out the fourth quarter of last year and first quarter of this year to an average of 1.35% to help see the point. This disparity between rates of sales and earnings growth makes sense because as businesses grow, so do expenses; sales and earnings do not tend to grow on a 1:1 ratio. Even if profit margins grow, which would cause earnings to grow faster than sales, there tends to be offsetting capital expenditure investments meaning companies reinvest capital to help grow their businesses. But, without a significant tax change, which we got last year and won’t be reflected in fourth quarter year over year changes, it is difficult to understand the cause of a significant expansion in earnings for the fourth quarter specifically.
If correct in analyzing the fourth quarter EPS estimates are too high, the above chart is very wrong. Looking back, the fourth quarter figure is 16.4 times or pretty close to the long-term average. Looking at the consensus expectations, the annual growth amounts to -.05% (assuming EPS are evenly adjusted per quarter). Consequently, an above average multiple doesn’t make sense with sub average growth expectations. Worse, if we assume a more realistic EPS number for the fourth quarter of 0.75% (a little better than what you would expect in the second quarter but not as good as the third quarter, based on relationship to sales), it kicks the multiple up over 16.7x and the expected growth down to -1.76%. No one wants to pay more for less, so this is worrysome.
Valuations are never a rationale to make an investing decision. They serve as a guidepost to how the situation looks as they add weight to the rest of your signals. As always, we welcome any questions you may have at 423-825-4796 or clientservices@acumenwealth.com.
Best,
Acumen Portfolio Management Committee
S&P 500 Index is widely regarded as the best single gauge in the U.S. equities market. The index includes a representative sample of 500 leading companies in leading industries of the U.S. economy. The S&P Index focuses on the large-cap segment of the market; however, since it includes a significant portion of the total value of the market, it also represents the market. All indexes are unmanaged, and an individual cannot invest directly in an index. Index returns do not include fees or expenses. S&P 500 data numbers were pulled from J.P.Morgan Guide to the Markets 2Q 2019 as of March 31, 2019.
Any charts, graphs, and descriptions of investment and market history and performance contained herein are not a representation that such history or performance will continue in the future or that any investment scenario or performance will even be similar to such chart, graph, or description. The opinions expressed in this commentary should not be considered as fact. Information contained herein is not and should not be construed as an offer, solicitation, or recommendation to buy or sell securities. The information has been obtained from sources we believe to be reliable; however, no guarantee is made or implied with respect to its accuracy, timeliness, or completeness. It is suggested that you consult your financial professional, attorney, or tax advisor with regard to your individual situation.