Acumen Market Insights: Staying Invested

Staying Invested
Recently, Beth Tremaine and Grant Allen with Acumen Wealth Advisors had the opportunity to meet with Mitch Zacks in Chicago. Since Mitch is a superstar in the realm of Portfolio and Investment Management, they obviously took the opportunity to ask him his thoughts on the current market and his outlook on the economy. Mitch’s number one advice to investors would be “stay invested”. It can be easy for investors to get trapped in “Herd Mentality”, generally defined as “how people can be influenced by their peers to adopt certain behaviors on a largely emotional, rather than rational basis.” In terms of investment, they tend to buy when markets are at all-time highs and sell when markets are suffering losses. According to Mitch and many other economists, these actions could be the biggest reason investors and fund managers so often fail to outperform. Abundant research supports this concept. The old advice of “staying invested” is hard for investors to follow, especially when rising volatility and worries about economic growth are flashing recessionary signals. Even then, staying the course and remaining invested in the markets is often the best way to make sure long-term goals are still on track. For the past year or more, Acumen has been cautioning investors of the probability of greater volatility in the markets. But what should investors do with this advice? What should be their next move? As boring as the advice may seem, the idea of remaining invested in the market and continuously leveraging the opportunity to lower cost basis and further compound returns is a time-tested and prudent principle. Investors should adhere to this principle instead of predicting about the potential end to the longest bull market in history.
Volatility
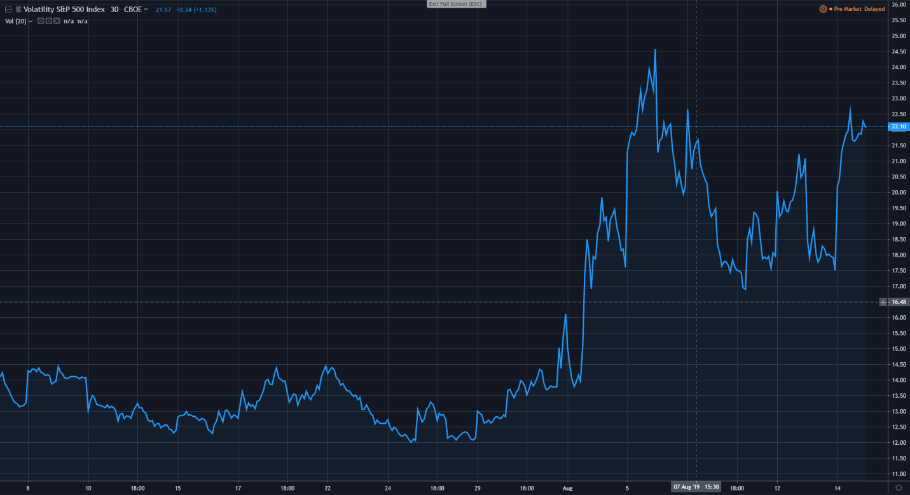
As we wrote to investors in our recent Market Insights, Acumen anticipates volatility. Although volatility is normal, we believe volatility will be more significant in the current equity market. The source of this volatility will be headwinds in the global economy, attributable to the current trade tensions. Trade tensions are beginning to be realized in slowing global growth. Understandably, volatility scares investors. This fear is especially true given the recent bias fueled by what happened in 2007 and 2008. This volatility causes political changes, economic hiccups or market corrections to feel like the sky is potentially falling, which turns into its own self-fulfilling prophecy as investors across the market hit the sell button across the board and further depreciate asset prices, causing even greater volatility. The sharpness of the volatility the markets experience can provide a rational investor with the ability to lower their cost basis and increase their returns. The chart provided by Trading View below is of the VIX Volatility Index for the last six weeks.
Perspective Matters
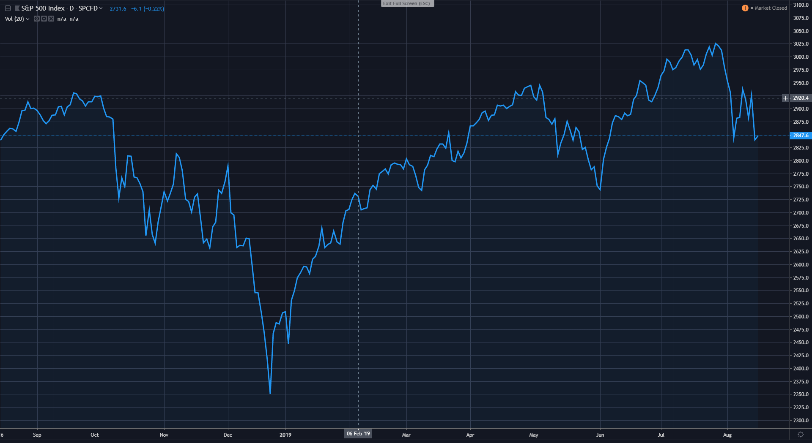
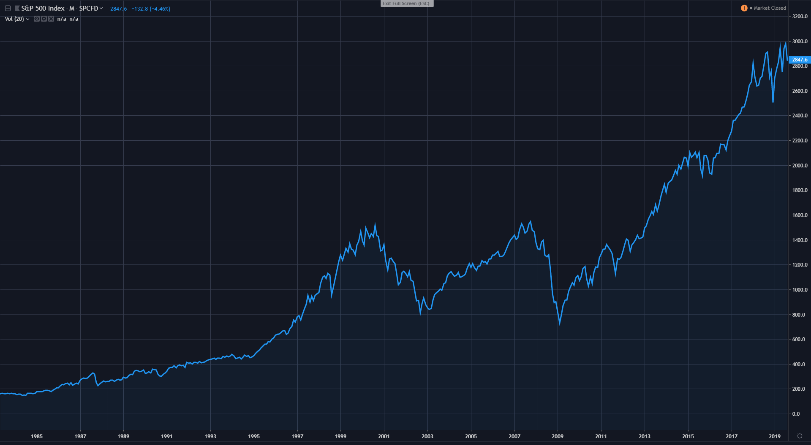
Many investors have the tendency to view the equity market and its performance from a short range of time. Below, two charts are provided by Trading View. The top is a view of the S&P 500’s performance during the last 12 months. The chart indicates the index has changed paths continuously throughout this specified time period. In the end, markets generated a relatively flat return. Show this chart to an investor and suggest they allocate funds to the underlying investment vehicle and you might be met with hesitation. This chart looks like a lot of trouble just for a 0.11% return. However, take a step back and look at the index for the last 30 years and we can get a different perspective. This second chart represents the same index since 1985. During this span of 30+ years, we can see two heavy market corrections. One was the .com bubble burst during the early 2000s, and the other was the financial crisis in 2008. However, if an investor would have stayed fully invested during this time frame, their equity allocation would have generated over 1,500% return; that’s 581.708% adjusted for inflation. The advantage of viewing the equity market from a different time frame is to see that yes, the broad equity market experiences times of prosperity, it experiences volatility, and it experiences downfall. However, when we take a step back, we can see the equity market has moved far higher up than down.
Equity Market Years Up versus Years Down
Investors tend to remember the bad times more vividly and much easier than we do the good times. When the market experiences a correction, this loss is felt much deeper than the prosperity of a 10-year bull market in its entirety. In behavioral finance, this is referred to as Loss Aversion. Loss Aversion is a concept associated with prospect theory claiming the pain of losing is psychologically about twice as powerful as the pleasure of gaining. This Loss Aversion can be represented in investors’ fear to weather the volatility of the market, even though the total number of years the market has performed positively, far outweighs the number of years we have experienced negative returns. In fact, from 1926 to 2018, the S&P 500 returned positive 68 of those years. That’s 73%. However, we remember the 25 years of negative returns with much greater disdain than we remember the years of positive returns with favor. In reality, the chance of a calendar year negative return in the equity market is not incredibly prominent, but when it is, it doesn’t seem to last long. Out of the 25 years we have seen negative returns in the S&P 500 since 1926, 12 of these downturns lasted one year. For the following year when investors saw positive returns, the average return of the S&P 500 was just over 20%. Therefore, trying to time the market, and investors taking their money in and out, often leads to either negative returns or, at the very least, missing out on some of the biggest upward movements.
Missing Out
The biggest problem investors face, when trying to time the market, is knowing when to get back in. Not only can investors cap their gains by selling when fears begin to climb, but they can also find it hard to locate a correct entry point after a correction has run its course. To show just how fickle finding the correct entry point in the equity market can be, displayed on the following chart is an investor’s return on $10,000 invested 20 years ago if 1) they were fully invested throughout the time period, 2) if they missed the 10 best days of performance, and 3) if they missed the 20 best days of performance. The contrast in these returns only shows how much performance an investor can miss when they incorrectly attempt to time the market.
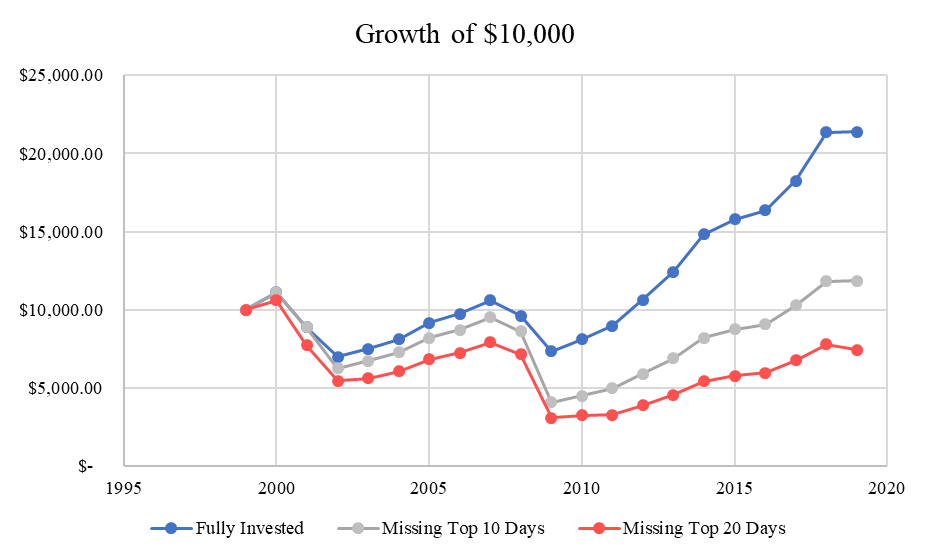
This chart was created from data collected at Yahoo Finance. This graph is hypothetical and for informational purposes only.
Weathering the Storm
Weathering the emotional roller coaster of investing can be one of the hardest behaviors for an investor. As investors, we often know what the rational action is to weather a market correction or impending recession. However, as humans, panic is sparked when watching the value of our portfolios fall, and these moments of loss is where we become illogical instead of rational. Instead of staying focused on the fundamentals and a long-term strategy, which includes defensive positioning, sound investments in stable cash-flow positive equities, and modest tactical adjustments, investors have a habit of letting their emotions dictate decision making. Rager Young, CFP®, a senior financial planner with T. Rowe Price says, “Attempting to time the market and avoid a downturn by making dramatic changes in your asset allocation can cause dramatic harm to your long-term investment results. This is because you have to accurately make two decisions that are likely to trip you up; when to get out of stocks and when to get back in.” Instead, it would make more sense for investors to remain fully allocated in a conservative position when volatility rises and global economic growth seems to slow, weather the emotional ride of a correction, and start allocating to a more aggressive positioning when we see the market at its worst. Below is a chart of the growth of a fully invested $10,000 in the S&P 500 if the investor would have allocated $5,000 more to their position after every calendar year of negative returns.
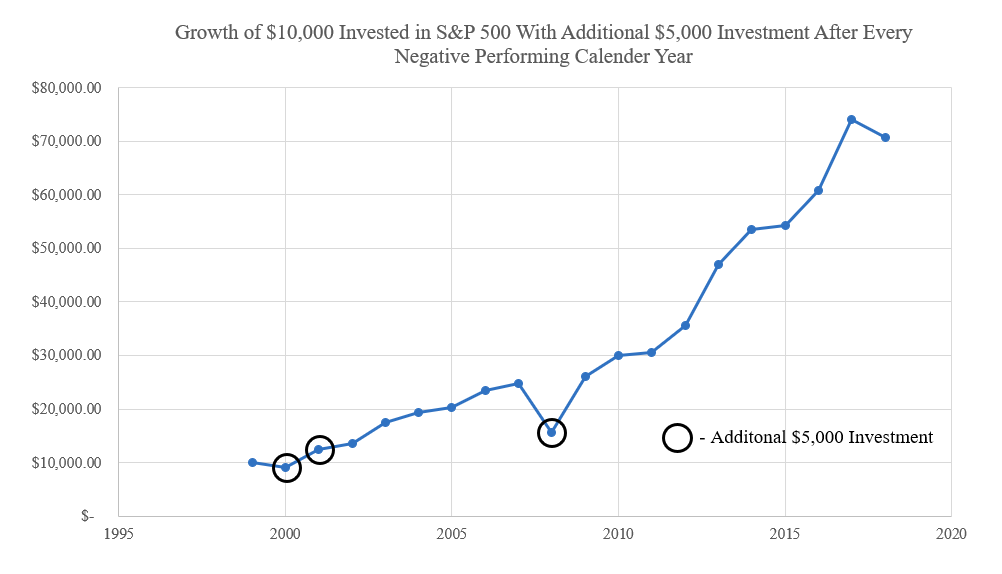
This chart was created from data collected at Yahoo Finance. This graph is hypothetical and for informational purposes only.
Acumen’s Portfolio Management Committee believes investors will continue to see rising volatility in association with geopolitical movements and slowing global economic growth. However, we also believe it is not in the best interest of investors to attempt timing the market. We have conservatively and defensively positioned our clients’ portfolios to weather the storm of the equity market, and we are confident a rational approach to investing will allow investors to reap the rewards of long-term strategic allocations through fundamental research.
Regards,
Grant Allen and the Acumen Portfolio Management Committee