Q2 2023 Market Commentary

The first quarter of 2023 provided no shortage of surprises. We were ultimately shocked at how well risk assets performed in the face of geopolitical uncertainty, continued restrictive monetary policy, and troubles within the banking industry.
The S&P 500 Index was up nearly 7.5% for the first quarter. The variance in performance across the stock market was a continuation from last year. While the NASDAQ was up a little more than 17% for the first quarter, the Dow Jones Industrial Average was up only 0.93%. In our opinion, the difference in performance across styles of the equity market is related to the reason behind the positive performance in risk assets – lower interest rates and lower expected interest rates in the future. The yield on the 10-year U.S. Treasury Bond went from approximately 3.9% to start the year to 3.45% to end the quarter. In fact, the entire spectrum of interest rates moved lower, and market participants even began pricing in the idea the Federal Reserve would have to cut their benchmark rate at some point this year. We believe this is a key factor to note for the first quarter of this year. We would attribute almost all the stock market’s positive performance to valuation expansion as a result of lower rates. Lower rates have also created a positive net performance in the bond market. As we have mentioned in the past, the price of bonds rise when bond yields fall. The aggregate U.S. bond market was up about 3.25% to start the year.
Macro Landscape
Economic Activity – We believe several leading economic indicators point to a recession in the next 6 to 12 months. The yield curve remains heavily inverted, the Conference Board’s Leading Economic Index (LEI) is flashing a clear recessionary signal and Purchasing Managers Indices (PMIs) are pointing towards a contraction in business confidence in economic growth. Additionally, housing activity is considered a leading indicator of economic growth. Existing home sales declined -22.65% in February compared to a year earlier. Home prices, as tracked by the Case-Shiller Home Price Index, have declined every month since June of 2022. We expect economic growth to continue to slow during the coming months, as indicated by this leading data, and because of the Fed’s aggressive monetary policy.
Labor Market – The unemployment rate is now 3.5%, a small change from January’s 3.4%, and remains around the lowest since the early 1970’s. To many this rate indicates a strong labor market. However, leading indicators of the labor market have begun showing signs of weakness. Job openings peaked several months ago, job cut announcements rose 319% in March compared to a year earlier, private payrolls in the most recent jobs report missed estimates by 29,000 jobs, and initial jobless claims have come in higher than expected over the last few weeks. Additionally, thousands of layoffs have been announced by companies like 3M, Amazon, Meta, Google, Accenture, Goldman Sachs, McKinsey, LinkedIn, Citigroup, GM, Dow, and more. We expect these leading signs will soon show up in more lagging labor market data and unemployment to rise.
Inflation – Inflation continued to move lower during the first quarter. The Consumer Price Index (CPI) fell from 6.4% in January to 5.0% in March. The majority of inflation today is being driven by services prices, which are being held up by lagging housing data. As we have stated previously, home prices have been falling since June 2022, which should show up in the CPI data during the coming months. Additionally, a survey of services-focused businesses shows their prices are coming down quickly and should help overall services inflation decline. While we expect inflation to move lower towards the Fed’s 2% target over the next several months, it is still elevated well above their target, and may take time before it sustainably reaches this target level.
Monetary Policy – Despite weakening economic data, lower inflation, and regional bank stresses, monetary policy remains restrictive. The Fed is likely to raise their benchmark rate an additional 0.25% in May to 5.25% stating they will hold this rate through 2023. We believe, if inflation remains above their target, the Fed is unlikely to cut interest rates, even in the midst of weakening economic growth and higher unemployment. At their most recent meeting, U.S. Federal Reserve Board members went on record stating a mild recession is the likely scenario in 2023 because of recent stresses in the financial sector. Still, they chose to raise rates, and indicated they will increase their benchmark rate again in May. Hawkish monetary policy, while economic growth is slowing, poses the threat of a more severe contraction. The one factor, which could cause the Fed to make a hard pivot from their restrictive path to a more accommodative one, would be a significant change in the economic environment.
In summary, we maintain our focus on leading data indicating where we are in the business cycle. Right now, we see: 1) lower economic growth in the near future, 2) rising unemployment, 3) lower inflation, and 4) restrictive monetary policy all pointing to the transition of the economy from a Slowdown phase to a Contraction phase.
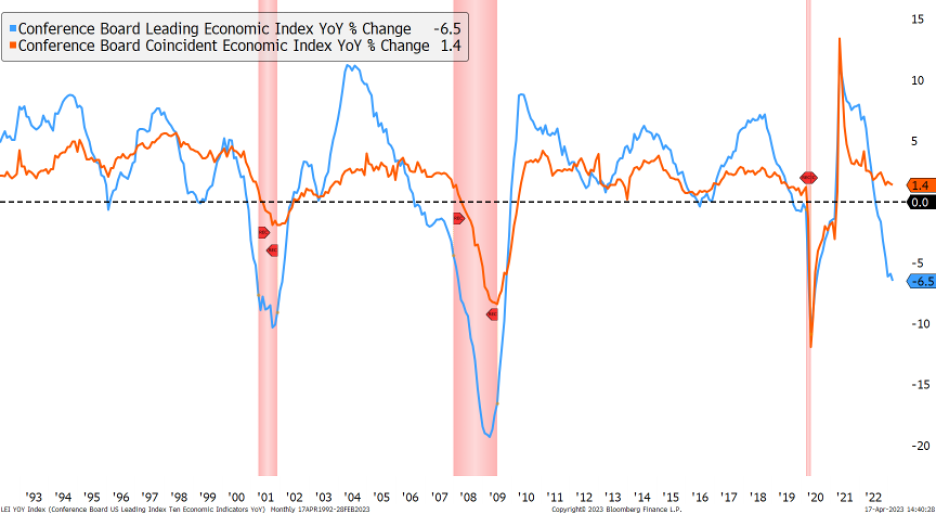
Figure 1 – Leading & Coincident Indicators Point Towards a Contraction
Portfolio Implications
Equities – As mentioned above, the stock market had a decent first quarter of the year and has challenged us to think through our defensive positioning and underweight to long-term equity targets in client portfolios. While we never want to succumb to the Fear of Missing Out (FOMO), movements, contrary to our outlook, give us an even better reason to stress test our thinking. Even given the stock market’s recent strength, we maintain the viewpoint of the risk/reward for stocks being skewed towards risk. For one, the Macro Landscape described above in which the economy transitions from a Slowdown into a Contraction is typically one in which stocks underperform. Most importantly, in our opinion, the fundamentals for the stock market over the next 6 to 12 months point towards a lower amount of upside over the short to intermediate term. Specifically, we prefer to compare the valuation landscape for stocks to other asset classes, like bonds. Right now, the relative valuation between stocks and bonds tilts the risk/reward for stocks specifically towards risk. Additionally, as mentioned above, we believe corporate profits could be revised lower throughout the year. While we are not currently optimistic about the short- to intermediate-term outlook for stocks, we believe there will be a significant buying opportunity in the future. While higher interest rates have hurt stock performance in the short term, they will ultimately be good for stock market performance in the long term. Speculative risk taking and malinvestment over the previous decade has been caused by artificially low interest rates. Taking away interest rates close to 0% will ultimately reintroduce a hurdle rate to investment, which should cause the market to deviate from some of the boom/bust behavior experienced in the previous decade.
Fixed Income – We became optimistic about bonds in the second half of last year. As detailed in the past and in the commentary above, the Fed has embarked on one of the most restrictive monetary policy regimes ever seen – causing interest rates and bond yields to rise incredibly fast throughout 2022. Our outlook concluded this change in interest rates would eventually slow and lead to weakness in the economy, causing yields to fall to a lower level. Additionally, yields on bonds across the fixed income universe are the highest in almost 20 years. These two factors have led us to an overweight to fixed income assets in client portfolios. On one hand, except for 2022, bonds typically play a defensive role in portfolios when equities perform poorly. We believe this trend would continue over the next six to12 months if the equity market sees more volatility. Basically, we regard bonds as providing defensiveness in portfolios alongside a higher amount of income than in years past. Within core bond portfolios, we have lengthened duration to a more neutral range to take advantage of higher yields for a longer period of time. We have also added short- to intermediate-term positions in short-term treasuries which offer attractive yields and provide dry powder in the event we see a buying opportunity in riskier assets at some point during the next 12 months.
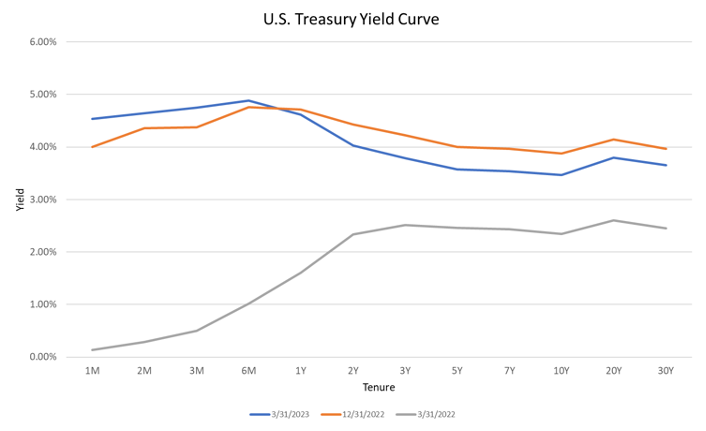
Figure 2 – U.S. Treasury Yield Curve as of 3/31/2023, 12/31/2022, and 3/31/2022
Alternatives – We continue to believe alternative investments across different spaces offer attractive return and diversification opportunities to investors. These opportunities exist across structured credit, private equity, and private real estate in specific geographies. One opportunity we find attractive is private residential real estate, specifically within the southeast region of the United States. While prices could be pressured in the short to intermediate term, we would look at those as opportunities to deploy capital.
Summary
In summary, our outlook for portfolio implications is to maintain a defensive positioning within client portfolios with the intent on building a game plan for investment moving forward. We continue to underweight riskier assets to equities relative to long-term targets and overweight assets like bonds which are paying a much higher yield than they have in recent decades. The Macro Landscape in our opinion also calls for lower yields in the future, which causes us to choose to lock in higher yields while we can. Additionally, we continue to believe Alternative assets can deliver both diversification and enhanced return to traditional asset classes over the long term.
Information used in this commentary was obtained via Bloomberg L.P.
The opinions expressed in this commentary should not be considered as fact. All opinions expressed are as of the published date and are subject to change. Information contained herein is not and should not be construed as an offer, solicitation, or recommendation to buy or sell securities. Investments in securities involves risk, will fluctuate in price, and may result in losses. The information has been obtained from sources we believe to be reliable; however no guarantee is made or implied with respect to its accuracy, timeliness, or completeness. It is suggested that you consult your financial professional, attorney, or tax advisor with regard to your individual situation. Comments concerning the past performance are not intended to be forward looking and should not be viewed as an indication of future results. Diversification does not protect against loss of principal.
The S&P 500 Index is a well-known, unmanaged index of the prices of 500 large-company common stocks, mainly blue-chip stocks, selected by Standard & Poor’s. The S&P 500 Index assumes reinvestment of dividends but does not reflect advisory fees. The volatility of the benchmark may be materially different from the individual performance obtained by a specific investor. An investor cannot invest directly in an index. Index returns do not include fees or expenses.
Any charts, graphs, and descriptions of investment and market history and performance contained herein are not a representation that such history or performance will continue in the future or that any investment scenario or performance will even be similar to such chart, graph, or description.
Acumen Wealth Advisors, LLC® is a Registered Investment Adviser. Advisory services are only offered to clients or prospective clients where Acumen Wealth Advisors, LLC® and its representatives are properly licensed or exempt from licensure. Past performance is no guarantee of future returns. Investing involves risk and possible loss of principal capital. No advice may be rendered by Acumen Wealth Advisors, LLC® unless a client service agreement is in place.